

Educational notice: This article explains academic microstructure concepts behind Toxic Order Flow and VPIN. It is educational material, not investment advice, trading signals, or a guarantee of future volatility or price direction.
Toxic Order Flow (TOF) is an order-flow metric derived from microstructure research on adverse selection — periods when aggressive market orders hit resting liquidity disproportionately on one side of the book. Rather than identifying specific traders or proving intent, elevated TOF highlights periods of pronounced order-flow imbalance that often coincide with thinner liquidity or heightened volatility.
In this guide:
- What adverse selection and Toxic Order Flow measure
- The VPIN academic intuition behind TOF
- How analysts review TOF alongside liquidation maps, open interest, and spreads
- Key limitations and common misinterpretations
What Is Toxic Order Flow?
Live market views: Explore modelled liquidation zones on the Bitcoin Liquidation Heatmap or review aggregated market tools on Features.
In market microstructure terminology, "toxic" does not describe legality or morality; it refers to adverse selection risk faced by passive liquidity providers (limit-order posters) when incoming flow is persistently one-sided relative to resting depth. In the Kingfisher interface, color coding distinguishes contributing venues (such as Binance and Bybit) so users can compare venue origin rather than assuming every reading comes from a single book.
Think of TOF as a gauge of flow imbalance rather than a directional forecast:
- Passive liquidity providers quote bids and asks to earn the spread.
- Imbalanced aggressive flow repeatedly lifts offers or hits bids on one side.
- Elevated TOF indicates that recent volume buckets show strong one-sided order-flow asymmetry.
Elevated readings frequently appear around news events, large hedging programs, or liquidation flushes, and they do not distinguish benign rebalancing from informed execution.
Microstructure Background: VPIN
The conceptual foundation for TOF is VPIN (Volume-Synchronized Probability of Informed Trading), introduced by Easley, López de Prado, and O'Hara (2012). VPIN partitions trading activity into equal-volume buckets rather than equal time intervals and compares absolute buy/sell volume imbalances across rolling buckets.
- VPIN measures flow toxicity / imbalance intensity, not future price direction.
- Proprietary implementations adapt parameters (such as bucket sizing, trade classification, and venue aggregation) for digital-asset perpetuals; exact internal calibration belongs to the platform engine and should not be inferred from chart colors alone.
- Reference definitions for order books and bid-ask imbalance cover the underlying book mechanics.
Important methodological note: Academic authors emphasize comparing current readings against an instrument's own historical context rather than treating a single isolated number as a universal threshold across assets or market regimes.
How Analysts Interpret Toxic Order Flow
Step 1: Observe Sustained vs. Brief Spikes
A single isolated bar can occur from one block execution or index rebalance. Analysts compare whether elevated readings persist across consecutive volume buckets and multiple observation windows.
- Is the shift isolated to one venue or visible across contributing derivatives venues?
- Is the reading occurring during an active trend extension or quiet range compression?
Step 2: Check Market Structure Context
Readings carry different interpretations depending on surrounding microstructure conditions:
- Proximity to modelled zones: Compare against liquidation map views to see whether leveraged estimates sit nearby, without assuming price must travel to those zones.
- Spread and book depth: Check whether quoted bid-ask spreads are widening or depth near top-of-book is thinning.
- Open interest behavior: Rising or stable open interest during aggressive flow points to new positioning, whereas sharp OI drops suggest forced closures or deleveraging.
Step 3: Monitor Feedback Loops Between Flow and Liquidity
Research on high-frequency liquidity dynamics notes that rapid aggressive execution can widen spreads and prompt market makers to pull passive quotes temporarily, which can amplify short-term price sensitivity until depth recovers. Recognizing this feedback loop helps analysts separate a temporary liquidity gap from sustained trend participation.
Microstructure Comparison: Forced Cascades vs. Gradual Positioning
| Order-Flow Characteristic | Forced Liquidation Burst | Gradual Positioning Flow |
|---|---|---|
| Execution Pattern | Burst of aggressive market exits | Distributed limit, iceberg, or TWAP execution |
| Open Interest (OI) | Typically declines sharply as positions close | Remains stable or expands gradually |
| Timing Profile | Compressed sub-second bursts near margin tiers | Spread over minutes or longer sessions |
| Bid-Ask Spread | Often widens abruptly as nearby depth clears | Tends to stay tighter while quotes replenish |
| Delta Profile | One-sided CVD spike followed by rapid slowdown | Steadier cumulative slope with two-way liquidity |
Analytical Setups Using TOF Context
1. Post-Spike Exhaustion Review
When a sharp TOF burst accompanies a rapid price extension and subsequently stalls with shrinking follow-through volume, analysts examine whether local short-term selling or buying pressure has exhausted itself.
2. Contextual Confirmation With Liquidation Maps
Rather than treating TOF as a standalone signal, analysts observe whether rising flow imbalance near a modelled cluster coincides with expanding spreads, keeping invalidation levels clearly defined in case price moves sharply against the premise.
3. Pre-Movement Range Monitoring
Gradually tightening book depth and rising two-sided uncertainty can appear before scheduled catalysts; however, elevated TOF during range bound trading does not guarantee the timing or direction of an eventual breakout.
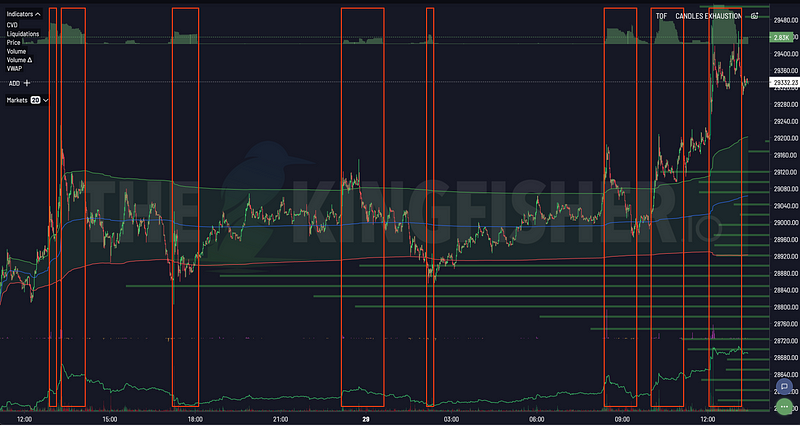
Illustrative Scenario: Cluster Sweep & Flow Imbalance

In an illustrative high-volatility move:
- Leveraged exposure accumulates near a nearby price range on the liquidation map.
- Quote depth tightens and TOF rises as aggressive taker flow enters the book.
- Once price crosses concentrated margin thresholds, forced liquidation orders accelerate short-term volatility before conditions stabilize once leverage resets.
This sequence demonstrates how TOF describes flow stress, while direction depends on where resting liquidity and active participation sit.
TOF vs. Related Microstructure Tools
| Metric | Primary Observation | Typical Horizon | Key Limitation |
|---|---|---|---|
| TOF | One-sided aggressive volume imbalance | Short-term intraday | Does not identify direction or participants |
| CVD | Cumulative signed buy minus sell volume | Short to medium | Sensitive to venue coverage and classification rules |
| Liquidation Maps | Model-estimated leveraged exposure zones | Structural | Estimates only; not guaranteed execution targets |
| RSI | Price momentum oscillator | Medium to swing | Lags sudden structural liquidity shocks |
| VWAP | Volume-weighted average reference price | Intraday to weekly | Resets at session boundaries |
Common Misinterpretations to Avoid
| Misinterpretation | Reality | Better Practice |
|---|---|---|
| Assuming high TOF proves "manipulation" | Imbalance reflects aggressive vs. passive flow | Focus on spread, OI, and liquidity effects |
| Using TOF to predict direction alone | VPIN relates to flow stress and volatility | Pair with market structure and strict risk limits |
| Trading every isolated bar | Single prints can skew short windows | Check persistence and multi-venue agreement |
Combining TOF With Options Gamma Exposure (GEX)
Microstructure flow and options positioning answer different questions. When options GEX+ estimates suggest negative gamma (where dealer delta hedging can trend-follow spot moves), elevated aggressive flow can coincide with wider intraday swings; in positive-gamma regimes, hedging flows may dampen isolated bursts. Always treat both GEX and TOF as conditional model context rather than deterministic forecasts.
Resources & Further Reading
- The Kingfisher Application — Inspect live authenticated dashboards and available coverage
- Platform Features — Overview of TOF, CVD, GEX+, and liquidation maps
- Documentation — Indicator definitions and usage notes
- Getting Started on The Kingfisher | CVD & Liquidation Maps
Frequently Asked Questions
Does TOF identify individual whales or prove market manipulation? No. VPIN-style order-flow metrics measure aggregate volume imbalance from public trade feeds; they cannot attribute orders to specific accounts or establish intent.
Does high TOF predict whether price will move up or down? No. Elevated flow toxicity indicates heightened short-term imbalance and potential volatility risk, not reliable directional certainty.
What is the difference between TOF and CVD? CVD tracks cumulative net aggressive buy minus sell volume, while TOF emphasizes the intensity of one-sided adverse-selection pressure within volume buckets.
Do I need to compute VPIN formulas manually? No. Kingfisher displays processed TOF views alongside liquidation maps and derivatives metrics inside the terminal.