Distilling Autonomous Research: How TheKingfisher Turns Market Microstructure into Risk Intelligence
From liquidation maps to specialized risk models, we are opening a new layer of quantitative intelligence to traders and developers.


Insights, analysis, and strategies from the Kingfisher trading desk.
Featured Articles
Research
From liquidation maps to specialized risk models, we are opening a new layer of quantitative intelligence to traders and developers.
Wed Oct 21 2026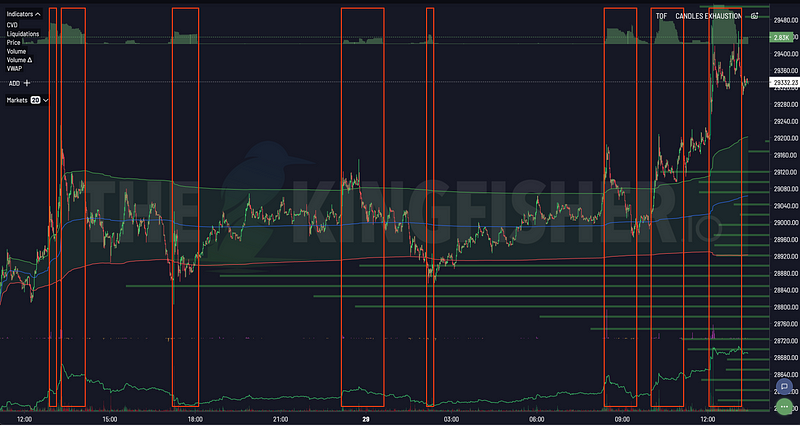
The Kingfisher
Understand Bitcoin Toxic Order Flow (TOF) using the VPIN framework: adverse selection, order-flow imbalance, volatility context, and limits.
Tue Feb 03 2026
The Kingfisher
A careful beginner workflow for reading Kingfisher liquidation maps, separating model output from interpretation, and documenting what the market actually does.
Tue Feb 03 2026Latest Posts
From liquidation maps to specialized risk models, we are opening a new layer of quantitative intelligence to traders and developers.

Compare CoinAnk, Coinalyze, Hyblock Capital and The Kingfisher against Coinglass: liquidation maps, free tiers, options data and pricing, checked October 2026.
Compare Coinglass, CoinAnk, Coinalyze and The Kingfisher against Hyblock Capital: liquidation levels, backtesting, free tiers and pricing, checked October 2026.
How to spot a short squeeze before it happens: read liquidation clusters, funding rates and open interest to find the signals that precede the spike.
Altcoin trading strategies 2026: use BTC dominance and sector rotation to time alt entries, and liquidation maps to avoid being exit liquidity.